Dewpoint
Barometric Pressure
Pressure Trend Current Wind
Wind Gust
Heat Index
Wind Run
Wind Chill
Precip Rate
Solar Energy
Wet Bulb Temp
Soil Temp
Return to Weather Site
Dew point
Dew point is the temperature to which air must be
cooled for saturation (100% relative humidity) to occur. The dew point is an important measurement used to predict
the formation of dew, frost, and fog. If dew point and temperature are close
together in the late afternoon when the air begins to turn colder, fog is
likely during the night. Dew forms when the air temperature is equal to or lower than the dew point temperature, and the dew point temperature is above freezing.
Frost forms when the air temperature is equal to or lower than the dew point temperature,
and the dew point temperature--technically called the frost point temperature--is below freezing.
Dew point is also a good indicator of the air’s actual water vapor content, unlike relative humidity, which takes the air’s temperature into account.
High dew point indicates high vapor content; low dew point indicates low vapor content. In addition a high dew point indicates a
better chance of rain and severe thunderstorms. You can even use dew point to predict the minimum overnight temperature.
Provided no fronts or other weather pattern changes are expected overnight , the afternoons dew point gives you an idea of what minimum temperature to expect overnight, since the
air is not likely to get colder than the dew point anytime during the night.
This is due to the release of latent heat energy as water vapor changes phase from gas to liquid or gas to solid,
the overnight low temperature rarely drops below the dew point temperature. Dew point depression (air temperature minus the dew point temperature) vs. cloud coverage &/or cloud height
(In general, when the surface dew point depression is small, skies will be overcast and cloud bases close to the Earth's surface.)
Also a dew point of 70 °F or higher makes the conditions uncomfortable for strenuous activities as the body
get very little help from evaporative cooling. There is a fine line between being damp and being humid and is determined by the how strenuous the person's activity is at that time.
Glen Allen Dew Point
Fog
Answers: Light, moderate, and heavy fog
By Jack Williams ©2012
Q: I have seen heavy fog defined as having a visibility of less than 0.3 miles.
But have never see what defines a moderate or light fog.
Is there some standard? Glen Allen, Va.
A: This sounds like a pretty simple question, but isn’t. First, here’s the definition of “fog” from the American Meteorological Society’s (AMS) Glossary of Weather and Climate:
“A visible aggregate of minute water droplets suspended in the atmosphere near the earth’s surface; a cloud in contact with the earth’s surface.
Fog is responsible for reducing visibility to less than 1 kilometer (5/8 mile).” Aviation weather observations and forecasts, intended for pilots, use “fog”
when it reduces visibility to 5/8 statute miles or less. “Mist” is reported and forecast for “foggy conditions” with visibility greater than 5/8 miles.
Like you, I’ve seen NWS offices use the terms “heavy fog,” “moderate fog,” or “light fog,” but I couldn’t find these terms in the NWS online Glossary or the AMS Glossary.
I asked Chris Vaccaro, the NWS public relations chief. He sent me the following from Paul Stokols, who’s with the NWS Public Weather Services Branch:
“The only official definition of fog intensity that I am aware of is in our directive for non precipitation products (10-515) which defines a “Dense Fog Advisory” as a product issued for
“Widespread or localized fog reducing visibilities to 1/4 mile or less.” The Weather element allows forecasters to differentiate between
F+ (heavy or Dense fog) , F (Fog or Moderate Fog), and F- (Light Fog) and the computer worded forecasts pick up on these distinctions.
However, there is no national standard for these definitions.”
He notes that most NWS forecast offices would use the code for heavy fog when the visibility is less than 1/4 mile, just “fog” when the visibility is between 1/4 mile to 1 mile and light fog for visibility of 1 miles or more.
“These tend to be set by forecasters based on local climatology for frequency of occurrence.”
Glen Allen Camera to see Local Visibility
Barometric Pressure
The
air that makes up our atmosphere exerts a pressure on the surface of the earth.
This pressure is known as atmospheric pressure. Generally, the more air above
an area, the higher the atmospheric pressure. This, in turn, means that
atmospheric pressure changes with altitude. For example, atmospheric pressure
is greater at sea-level than on a mountaintop. To compensate for this
difference in pressure at different elevations, and to facilitate comparison
between locations with different altitudes, meteorologists adjust atmospheric
pressure so that it reflects what the pressure would be if measured at
sea-level. This adjusted pressure is known as barometric pressure.
Barometric
pressure changes with local weather conditions, making barometric pressure an
important and useful weather forecasting tool. High pressure zones are
generally associated with fair weather, while low pressure zones are generally
associated with poor weather. For forecasting purposes, the absolute barometric
pressure value is generally less important than the change in barometric pressure.
In general, rising pressure indicates improving weather conditions,
while falling pressure indicates deteriorating weather conditions.
Air pressure often indicates cloud coverage
Also cloud coverage generally indicates the daily maximum and minimum air temperature range -
(In general, there is a greater temperature range when skies are clear,
and a smaller temperature range when skies are overcast.)
(In general, low air pressure is associated with cloudiness and a chance of precipitation;
high pressure is associated with fair weather and clear skies.)
Wind is cause by air flowing from higher pressure into lower pressure.
What causes pressure differences?
The high and low pressure systems usually develop due to temperature differences.
Temperature differences result in pressure differences and this causes the air to move
Thus, the greater the change in the air pressure the greater the possibility of strong winds.
When it is windy outside, often there is a low pressure system the air is moving toward.
How fast the wind blows will depend on the pressure differences between the high and low pressure systems.
Very fast winds often occur near cold fronts, low pressure systems.
Wind can also blow faster when it is forced into a narrow space.
This can happen between buildings and within mountain passes.
Thus the following saying--
The higher the high and the lower the low,
the faster the wind will flow from the high to the low,
and the stronger the winds will blow.
Glen Allen Barometric Pressure - Scroll down to see the daily wind and pressure graphs .
Pressure Trend
"Rising Rapidly" -
pressure increases more than 2 mb (>0.06") over past three hours
"Rising Slowly"
- pressure increases more than 1 mb but less than 2 mb (> 0.02" but < 0.06")
over past three hours
"Steady" - pressure changes less than 1 mb (< 0.02")
over past three hours
"Falling Slowly"
- pressure falls more than 1 mb but less than 2 mb (> 0.02" but < 0.06")
over past three hours
"Falling Rapidly" - pressure decreases more than 2 mb (>0.06") over past three hours
Wind Direction vs. Temperature - - -
When the wind is coming from the north, air temperatures are usually cooler;
Southerly winds usually bring warmer temperatures.
Along the East Coast of the U.S., easterly winds usually bring cooler air onshore during the Summer and warmer air onshore during the Winter.
Sustained Wind
Sustained
wind is the average direction and speed for the last 2 minutes.
Gust
Wind gust represents the
highest wind speed observed in the last 10 minutes. Gusts are displayed if
the gust speed is above 10 mph and at least 5 mph higher than the current (2 minute average) wind speed.
Glen Allen Wind Information -
Scroll down to see the daily wind and pressure graphs .
Solar Energy
What we call
"Solar Energy" is technically known as global solar radiation, a measure of the intensity of the sun’s radiation reaching a
horizontal surface. The Vantage Pro solar sensor measures both the direct
sunlight component and the diffuse (reflected & scattered light) component from the rest of the sky. The solar radiation
reading gives a measure in Watts per square meter (W/m2). High Solar Energy is the peak
solar radiation measured during the calendar day.
By
comparing the observed solar energy to the maximum possible for a given time of
the day and year a probable sky condition can be determined.
Maximum possible solar energy is derived by computing the deviation from the
known solar constant (1366 W/m2)
as a
function of the cosine of the sun's elevation above the local
horizon. Clear sky attenuation is applied to this value, as a cosine function of the sun's elevation. The most intense possible radiation is always at
solar noon and tapers to zero at sunrise and sunset. Percent possible
intensity is displayed after the radiation value.
Glen Allen Solar Radiation Information - Scroll down to see the daily wind and pressure graphs .
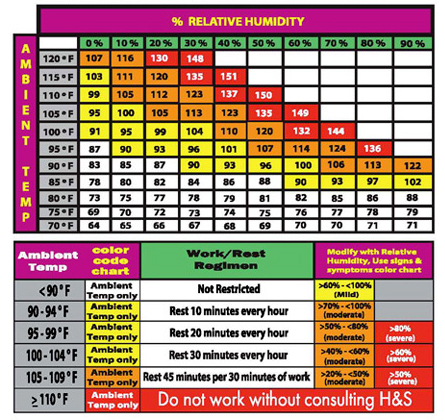
Heat Index
The Heat Index uses the
temperature and the relative humidity to determine how hot the air actually
"feels." When humidity is low, the apparent temperature will be lower than the
air temperature, since perspiration evaporates rapidly to cool the body.
However, when humidity is high (i.e., the air is saturated with water vapor) the
apparent temperature "feels" higher than the actual air temperature, because perspiration evaporates more slowly.
(The daily high temperature usually occurs sometime during the afternoon between 1PM and 3PM
Glen Allen Heat Index Information in Right Column
Wind Run
Wind run is measurement of the "amount" of wind passing the station during a given period of time, expressed in either "miles of wind" or "kilometers of wind".
WeatherLink calculates wind run by multiplying the average wind speed for each archive record by the archive interval.
For Example:
Average Wind Speed = 5 mph
Archive Interval = 30 minutes (0.5 hours)
Wind Run = 5 mph x 0.5 hours = 2.5 miles of wind
A Weather Station uses a 5 minute archive interval.
Then the 5 minute archive records are totaled for the 24 hour period from midnight to midnight giving the wind run for the day in miles.
Glen Allen Wind Run Information near the Bottom of the Chart
Wind
Chill
Wind chill temperature is how cold people and animals
feel when outside. Wind chill quantifies the rate of heat loss from exposed
skin caused by wind and cold. As the wind increases, it draws heat from the
body, driving down skin temperature and eventually the internal body
temperature. Therefore, the wind makes it FEEL much colder. If the temperature
is 0°F and the wind is blowing at 15 mph, the wind chill is
-19°F. At this wind chill temperature, exposed skin can freeze
in 30 minutes.
The
only effect wind chill has on inanimate objects, such as car radiators and
water pipes, is to shorten the amount of time for the object to cool. The
inanimate object cannot cool below the actual air temperature. For example,
if the temperature outside is -5°F and the wind chill
temperature is -31°F, then your car's radiator will not drop
lower than -5°F.
Note:
10-minute average wind speed is used to calculate wind chill
Glen Allen Wind Chill Information in the Third Column of the Chart
Precipitation Rate
The
precipitation rate is calculated by measuring the time interval between each measured
precipitation increment of .01". When there is precipitation within the archive period, the highest measured
value is reported. When precipitation ends, the rain rate will slowly decay
based on the elapse time since the last measured precipitation. If no
precipitation is measured for 15 minutes the precipitation rate is reset to zero.
Evaporation
Evaporation is the estimated amount of water vapor returned to the air based on measured temperature, relative humidity,
average wind speed, and solar radiation.
Wet Bulb Temperature
The wet bulb temperature is a measure of the
amount of moisture, in the form of invisible water vapor contained in the air.
As the name implies it is measured by a standard thermometer whose bulb is
covered by a muslin sleeve that has been moistened by pure water. This is
the temperature air can be cooled to by evaporating water into it and therefore
the wet bulb temperature provides a good estimate of how far temperatures will
fall if it starts raining or snowing.
The principle of the wet bulb thermometer is
as follows; water evaporates from the muslin cover passing into the air in the
form of invisible water vapor. In so doing it absorbs
heat from the thermometer bulb. The thermometer
therefore indicates a lower temperature than that of the dry bulb thermometer.
The difference between the readings of the dry and the wet thermometers is
called the depression of the wet bulb.
If the air contains nearly all the moisture
it can possibly hold, evaporation from the muslin will be slight and the
depression of the wet bulb will be small. However, if the air is very dry,
containing little moisture, evaporation will be quite rapid and the depression
of the wet bulb will be quite large. In hot dry desert climates depressions of
over 25°C have been observed, but at sea the depression is seldom more than 5°C.
If the air contains all the moisture it can possibly hold, there is no
evaporation from the muslin, and the dry and wet bulb thermometers will read the
same. When this condition exists the air is said to be saturated.
Provided that the wet bulb is adequately
moistened and given proper ventilation, its reading will always be equal to or
less than that of the dry bulb when the air temperature is above freezing. Under
certain conditions when the air temperature is below freezing and there is ice
on the wet bulb, its reading may be slightly higher than the dry bulb. This is
called a negative depression and usually occurs with fog or precipitation.
Negative depressions are rare.
Soil
Temperature
Soil
temperature is reported to the nearest degree Fahrenheit and is measured at a
depth of 5 inches and 12 inches depth beneath a grassy surface.
This data is at the following link.
Glen Allen Soil Temperatures -
Scroll down to see the Weekly and Monthly Graphs .